What to do when there exists spill-over effect in your ab-testing?
 Image credit: Dennis Meisner
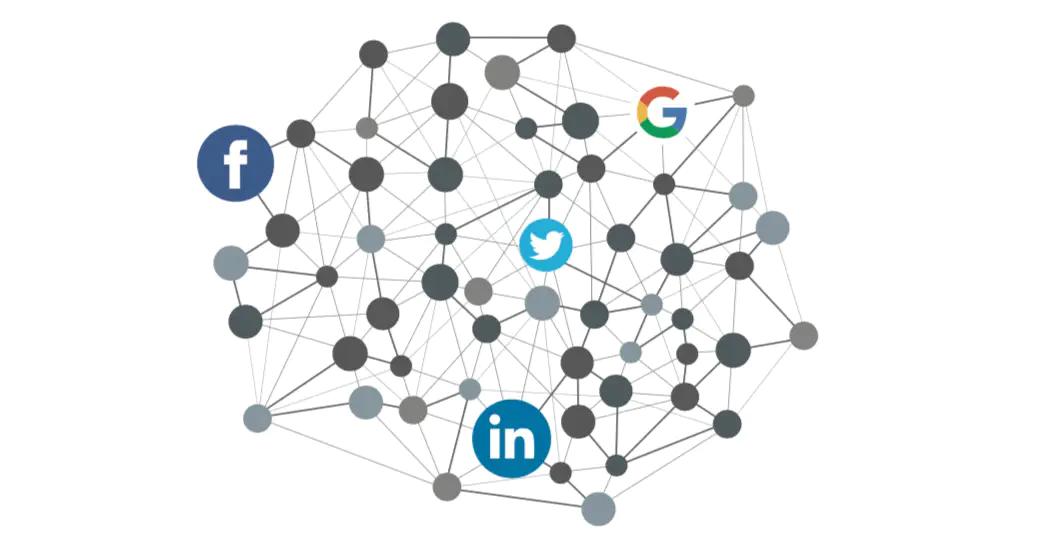
A/B testing is a powerful decision-making tool. However, if social network spill-over effect exists, then the average treatment effect will be underestimated. This is because the control group will also be exposed to some condition of treatment.
The question is: how to solve it? I have seen two ways of how this can be approached. First approach completely eliminate spill-over effect. The second approach is to directly measure the spill-over effect.
1. Eliminate Spill-over Effect
The first approach, which I believe is the most common one, is to use clustering. Clustering, in experimental design, is to set all units in one cluster into treatment or all units into control. In this way, if we cluster the customers by their social network so that each cluster has the minimum interaction, then the spill-over effect is minimized, if not completely eliminated.
For instance, if Linkedin wants to test a product, then the research team will probably cluster all the linkedin users into different groups by their first and second connection. This should be done by a clustering algorithm such that a unit in one cluster should not be a friend of many units in another cluster. Some readings about this can be found on this post.
Then, in the post-experiment stage, researchers can relax and use the traditional way to compute ATE.
2. Measure Spill-over Effect
Unlike the first approach where most of the work is done in pre-experiment stage, the second method will solve spill-over effects from post-experiment calculation.
If for some reason, say the company cannot cluster users perfectly, then what is the solution? We can just acknowledge there exists social-network spill-over effect and measure it. Also, it might be useful sometimes to see both the direct and indirect effect.
Here, we can define an exposure mapping f that maps units into four groups: 1. Direct Exposure Group, 2. Indirect Exposure Group, 3. Direct + Indirect Exposure Group, 4. No Exposure Group. If the unit is directly treated, and none of its friends is treated, then this unit is in group 1, If the unit is not directly treated, but some of its friends are treated, then this unit is in group 2, etc.
In this way, we can compute the ATE between group 1 - group 4, group 2 - group 4, and (group 3 - group 1) - (group 2 - group 4), which are main effect, indirect effect, and interaction effect respectively. For example, consider our company has 6 clients: A, B, C, D, E, F. The social network is {A}, {B,C,D}, {E,F}. If A, B, C are treated, then group 1 has A, group 2 has D, group 3 has B, C and group 4 has E, F.
However, there comes one question: Can we use diff-in-means to compute Average Treatment Effect?
Answer: No, because SUTVA is violated and diff-in-means will be biased
Since the probability of being in a group differs by unit, a simple diff-in-means will be biased. The solution is to use Horowitz-Thompson estimator, or Weighted Least Square regression that adjust for the probability of being in different groups.
Let us define Exposure Prob(i, k) to be the probability of unit i being in exposure group k.
Another question raises: how to compute Exposure Prob(i, k)?
Consider the previous case where we have six clients A, B, C, D, E, F. If we randomly put half of the units into control and the other half into treatment (Complete Randomized Experiment), what is Exposure Prob(A, 1)? It will be 1/2 because A has half of chance to be put into treatment and it has no peers. What about Exposure Prob(B, 1)? It is a more complex story: B will be in the direct exposure group only if B is treated and neither C or D is treated. The prob is not simply 1 / 2^3 because it is a drawing without replacement sampling. It will be 3 / (6 choose 3) instead if my algebra is right. What about Exposure Prob(B, 3) then? This happens when B and one of C and D are treated. It is even more complex, though computable.
Do you see the problem of solving it analytically? If we have thousands of clients and each social network cluster has over 10 peers, it is really difficult to compute the Exposure Prob one by one in closed form.
One easier solution is to solve it by Monte-Carlo approach. We can just simulate thousands of randomization, and see what is the sample Exposure Prob. This approach also has a down-side: it requires a large computation power, and if one of the Exposure Prob(i, k) is small, the error will be huge.
Aronow and Samii proved that the bias is bounded by
Therefore, the estimated Exposure Prob(i, k) will be way off if R or min_p is wild.
Let us now assume we already got a good estimate of Exposure Prob(i, k), then we can use an inverse-Exposure Prob(i, k) Horowitz-Thompson estimator or WLS estimator to compute an unbiased ATE for main effect, indirect effect, and interaction effect.
A big problem here is that it is challenging to compute Exposure Prob(i, k) right, and, when it doesn’t, a conventional OLS estimator will be better than these two fancy ones.
Conclusion
To solve spill-over effects, we can either eliminate it, or directly measure the effects. However, it seems to me that we cannot apply both at one time. The first approach is practical and relatively easy. The second approach can give more insights if Exposure Prob(i, k) is computed correctly.